If you’ve ever seen an analyst on TV say a stock is “worth $150” when it’s trading at $120, there’s a good chance a DCF model is hiding behind that number. It sounds intimidating — rows of formulas, growth rate assumptions, discount rates — but the core idea is something you already understand intuitively. You just haven’t seen it written in Excel before.
The Core Rule: A Dollar Tomorrow Is Worth Less Than a Dollar Today
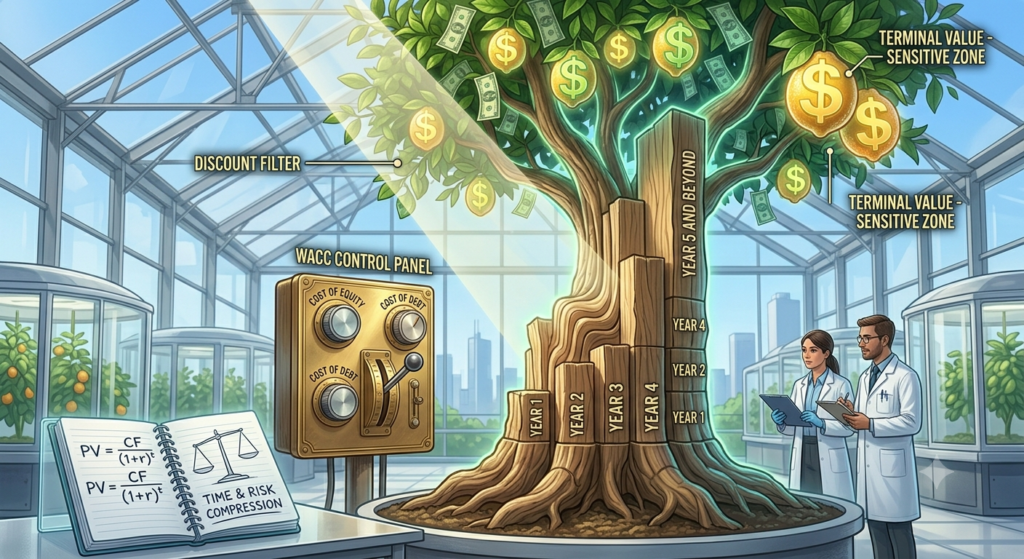
Imagine someone offers you a deal: they’ll plant a tree in your backyard that drops a crisp $100 bill every autumn, for the next ten years. How much would you pay today for that tree?
Your gut probably tells you it’s not simply $1,000 (10 years × $100). Money you receive next year is worth less to you than money in your hand right now — you could invest today’s cash and grow it, prices could rise and erode its purchasing power, and there’s always a chance something goes wrong before next autumn arrives.
That gut instinct is the entire foundation of a DCF model. Finance just gives it a formula:
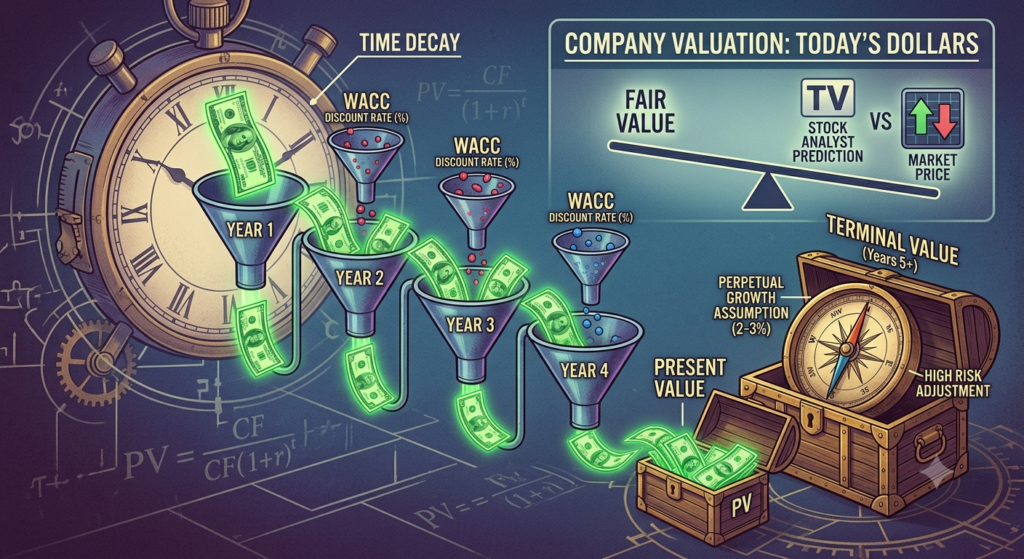
PV = CF / (1 + r)^t
Translated: the present value (PV) of a future cash flow (CF) shrinks the further out in time (t) it lands, and the rate at which it shrinks depends on a discount rate (r) — essentially, how much you demand to be compensated for waiting and for taking on risk.
A DCF valuation just does this same math for every cash flow a company is expected to generate — this year, next year, and every year after that — then adds up all those “shrunk” values into a single number: what the entire business is worth today.
How WACC Acts as the Company’s “Interest Rate on Existing”
The discount rate isn’t arbitrary — analysts use something called the Weighted Average Cost of Capital (WACC).
Think of WACC as the blended interest rate a company effectively pays just to keep existing. A business is funded by a mix of debt (loans, bonds) and equity (shareholders), and both groups expect to be compensated:
- Lenders want their interest payments — a defined, contractual cost.
- Shareholders want returns commensurate with the risk of owning stock — a less certain, but real, expectation.
WACC blends these two costs, weighted by how much of the company is funded by each, into a single discount rate. A company that’s riskier, more leveraged with debt, or operating in a volatile industry will have a higher WACC — meaning its future cash flows get discounted more aggressively, and are worth less in today’s dollars.
This is why two companies can generate the exact same future cash flows on paper and still be valued completely differently. The one with more risk baked into its capital structure gets a steeper “tax” applied to its future money.
Why Small Changes in Terminal Value Assumptions Ruin DCF Accuracy
Here’s the part most retail investors don’t realize, and it’s the single biggest weakness of DCF models: analysts can’t forecast a company’s cash flows forever, so at some point they stop projecting year-by-year and instead estimate one giant lump sum called the Terminal Value — essentially, “what is all the cash flow from year 11 onward worth, today, in one number?”
The problem is that Terminal Value often accounts for 50-80% of a DCF’s entire valuation, and it depends on a couple of highly sensitive assumptions — namely, an assumed long-term growth rate and the same discount rate from earlier. Nudge that growth rate from 2% to 3%, and the resulting valuation can shift by tens of billions of dollars for a large company, even though nothing about the actual business changed.
This is the tree analogy again, but stretched to infinity: if someone told you your $100-a-year tree would keep dropping cash forever, your valuation of that tree becomes almost entirely dependent on how confident you are it’ll still be standing — and still as productive — decades from now. Small shifts in that confidence swing the price enormously.
A Simplified Example: Valuing the Money Tree
Let’s put numbers on the tree analogy. Say a company is expected to generate the following free cash flows over the next four years:
- Year 1: $100 million
- Year 2: $110 million
- Year 3: $121 million
- Year 4: $133 million
If the company’s WACC is 10%, each of those future dollars gets discounted back to today using the PV formula. Year 1’s $100 million becomes about $91 million in today’s terms; Year 4’s $133 million shrinks to roughly $91 million as well, since it’s further away and has more time to be discounted. Add up all four discounted years, and you get the present value of the explicit forecast period — before Terminal Value even enters the picture.
Then comes the big number: assume cash flows keep growing at 2.5% forever after Year 4, and using the same 10% discount rate, the Terminal Value calculation could easily produce a figure several times larger than the sum of all four forecasted years combined. That single number — an assumption about growth decades from now — often ends up carrying more weight in the final valuation than everything the company is actually projected to earn in the near term. It’s a useful gut-check the next time a price target seems to hinge on a single confident-sounding growth assumption.
Frequently Asked Questions
What discount rate should I actually use? Most analysts use the company’s WACC as a starting point, but retail investors doing back-of-envelope math sometimes substitute a simpler “required rate of return” — often somewhere between 8-12% for equities, adjusted up for riskier or smaller companies.
Is DCF reliable for high-growth or unprofitable companies? It gets shakier. Young, high-growth companies often have negative or unpredictable near-term cash flows, which makes the Terminal Value assumption do even more heavy lifting than usual — and small changes in when a company is assumed to turn profitable can swing the valuation dramatically.
Why do two analysts get different DCF values for the same stock? Because the formula is objective but the inputs aren’t. Growth rate assumptions, discount rate selection, and how far out to forecast before switching to Terminal Value are all judgment calls — which is exactly why DCF is best used as one data point among several, not a single source of truth.
The Takeaway
A DCF model isn’t magic — it’s a structured way of asking “what are this company’s future dollars worth to me today, given the risk of getting there?” The math is precise, but the inputs — growth rates, discount rates, terminal assumptions — are judgment calls dressed up in decimal points. That’s why two equally qualified analysts can run a DCF on the same company and land on wildly different price targets. They’re not disagreeing about the formula. They’re disagreeing about the future.
Next in this series: Enterprise Value vs. Market Capitalization — why the number on your stock ticker never tells the whole story.